

How to use the Dashboard:
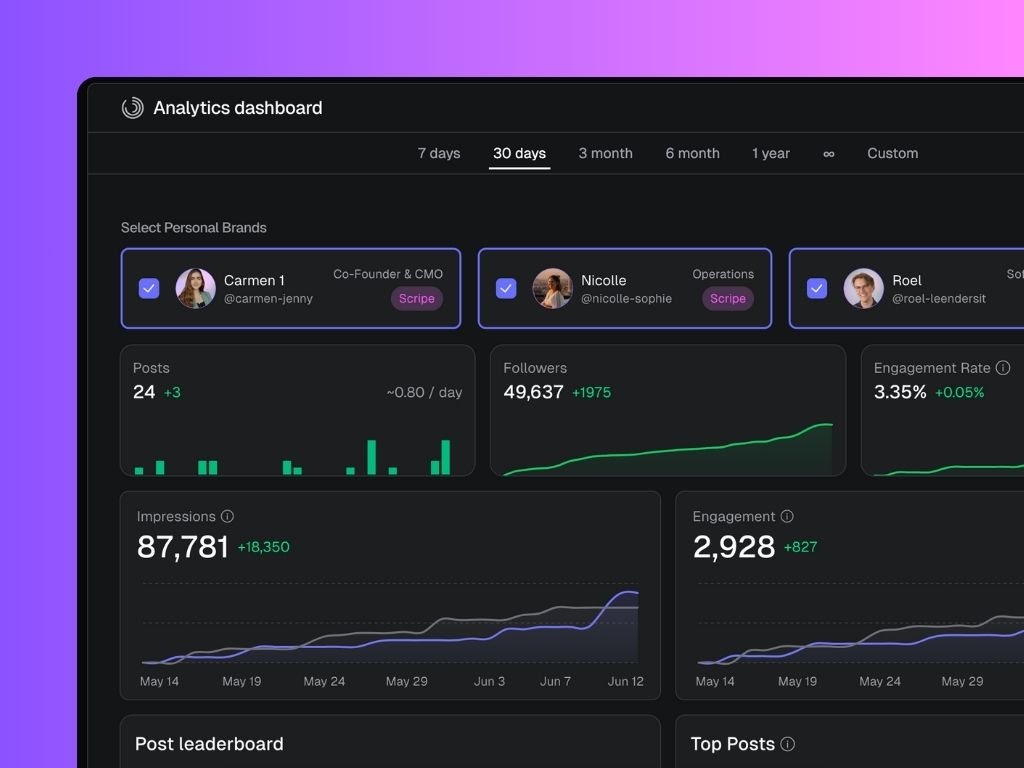
- Select Personal Brands to compare: Use the checkboxes at the top to choose which team members’ data you want to include in your view.
- Select a date range: Switch between 7 days, 30 days, 3 months, 6 months, 1 year, or custom ranges to analyze performance over time.
Key Metrics Tracked
- Posts: Number of posts published
- Impressions: Total reach
- Followers: Growth in LinkedIn followers
- Engagement Rate: % based on likes, comments, shares per impression
- Engagement Count: Total interactions (likes, comments, shares)
Leaderboards
Scripe automatically surfaces your top performers:- Post Leaderboard: Who posted the most in the selected time period
- Engagement Leaderboard: Ranked by impressions, likes, or comments per post
- Top Posts Section: View the highest-performing posts for the selected period. These are great for repurposing or understanding which formats and topics resonate most with your audience.
Team Posting Behavior
- Optimal Timings Chart: Identify time-of-day slots that generate the most impressions
- Post Frequency Heatmap: See when your team is posting (day + week)
Content Table
Dive into individual post-performance across all brands:- Content Type & Tags
- Post text preview
- Impressions, Likes, Comments, Shares
- Engagement Rate
- Date created